Google Chrome DevTools is getting better and better everyday, ridiculously fast performance with their Blink and V8, and they just got better with their DevTools. What I just found out recently was, editing source code right on the Chrome DevTools using source mapping.
Source Maps
To verify is source maps is turn on, go to the setting gear icon on DevTools, and then verify the Source Maps option are checked.

Setting Up Workspace
After enabled the feature, we’ll need to setup a workspace, which the folder where our source located (or the minified scripts we hosting in our local server).
Open the Developer Tools from menu, shortcut or inspect any element on the page, click on the setting gear icon on the lower right to bring up settings dialog, click on Workspace on the left hand side panel, and browse the folder where our source is located, and allow when Chrome ask for permission.

Now our Chrome being mapped to our local folder properly. Now we can load our page from the folder in Chrome (note that we can browse using local IP).
Let say I have an HTML page called index.html, a JavaScript file called app.js and a CSS file called app.css, which looks like this

I have 2 heading (why not, I like it big), one of them have an id, which will be use to display some text when a button was clicked, yeap, I have a button on the page as well, which will be attached to a click event in my JavaScript function, and my CSS just doing simple color and background color styling at the moment.
Editing JavaScript
Now we can access the source from the Chrome by going to the Sources tab in dev tool and then locate our JavaScript file from the panel.

If I didn’t add the folder in the workspace, I wouldn’t be able to see the ChromeDev folder over there.
Sometimes I do encounter problem where the folder showing up, but DevTools did not know which file is mapped to which, so I’ll have to do it by right clicking on the code where I wanted to map, and choose Map to File System Resource.

After that I’ll be presented a list of matching file name for me to choose.

So now the button sitting there doing nothing, let’s add function to the sayWhat function directly inside the DevTools. Once we edited the code, there will be a small * on the tab to indicate we made some changes and it have not saved.

So, simply hit Cmd + S or Ctrl + S to save the code. In this case, we no need to reload our page to reload the code, we’ll just go click the button again and it will works, from my experience, it even works while we debugging the JavaScripts, very powerful.
After we happy with all of our changes, head back to our local folder, and we’ll be happy that the changes we made in DevTools persisted back to our source code.
Revision
Wait! What if I want to get back some code that I amended but dev tool overwrite my source code on the disk, how?
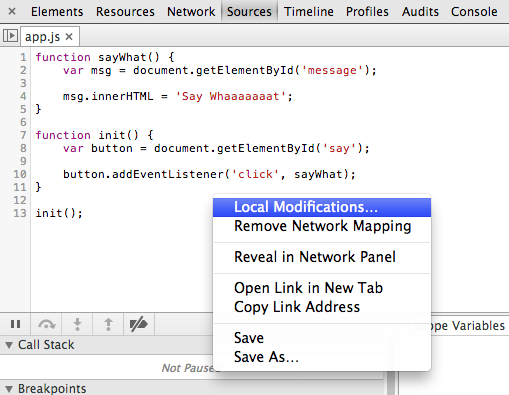
No problem, DevTools helps us to keep our code revision. Just right-click on the file we are working on, and choose Local Modifications.
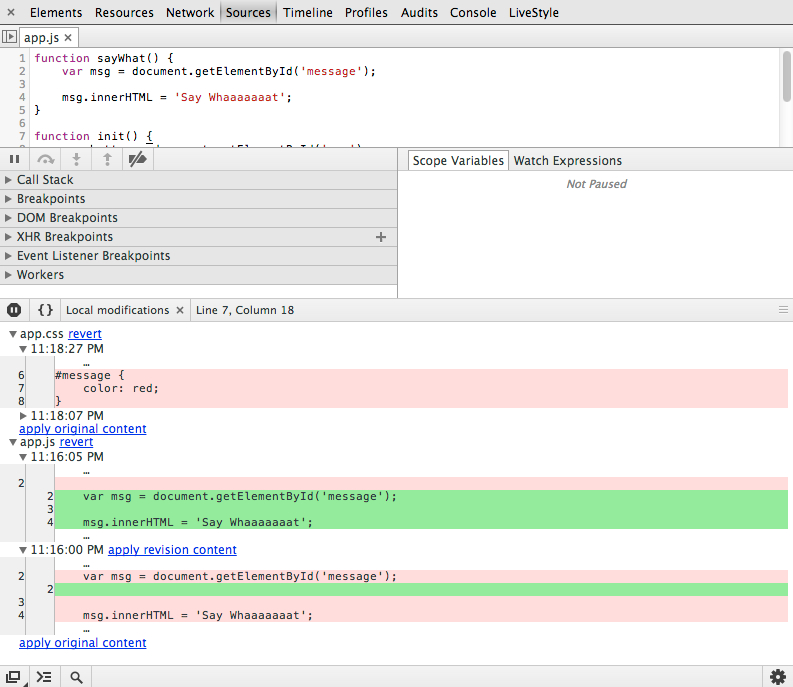
Our change history will be show with the ability to revert back to that particular revision.
Even though DevTools provide a convenient way for us to track the changes, I still prefer to work on a duplicate copy, just in case.
These are just a tiny bit of what DevTools can do, and I’m sure Chrome team will continue add more and more capability to the tool.